Craig Shephard
APPLIED AGRICULTURAL REMOTE SENSING CENTRE, UNIVERSITY OF NEW ENGLAND
MACADAMIA SOUTH AFRICA
Under a Macadamias South Africa NPC (SAMAC) initiative, researchers at the University of New England’s Applied Agricultural Remote Sensing Centre (AARSC) have completed the national map of all commercial macadamia orchards across South Africa. The total production area of macadamia orchards mapped across South Africa is 72 652 ha.
The mapping delivers an accurate understanding of the extent (distribution and area) of macadamia plantings. No grower or commercial information are collected or included. This foundational information is essential to inform traceability and forward selling, support biosecurity preparedness and for post-natural disaster response and recovery. Knowing where crops are located is vital for timely response to biosecurity incursions, to establish exclusion zones and coordinating on-ground surveillance, as well as quantifying the area of crops impacted following a natural disaster.
Field validation was completed for three provinces, targeting known areas of uncertainty. Many new plantings were observed which added a further 1 461 ha to the map: 342 ha in KwaZulu-Natal, 505 ha in Mpumalanga and 614 ha in Limpopo. This analysis clearly demonstrates the value of field validation, where remote sensing alone (satellite imagery) cannot accurately map new plantings.
Industry participation in peer review of the draft map using the Industry Engagement Web App(IEWA) (https://arcg.is/TurWa) has proven highly successful, with 1 027 comments received. This feedback added 3 988 ha of orchards to the map (mostly new plantings), confirmed 2 780 ha were correctly mapped (macadamia) and removed 2 409 ha that were other tree crops, eg. avocado, citrus, litchi. This engagement is highly encouraging as a project outcome as it demonstrates the greater industry-wide support of SAMAC in the collation of accurate industry data for the betterment of all.
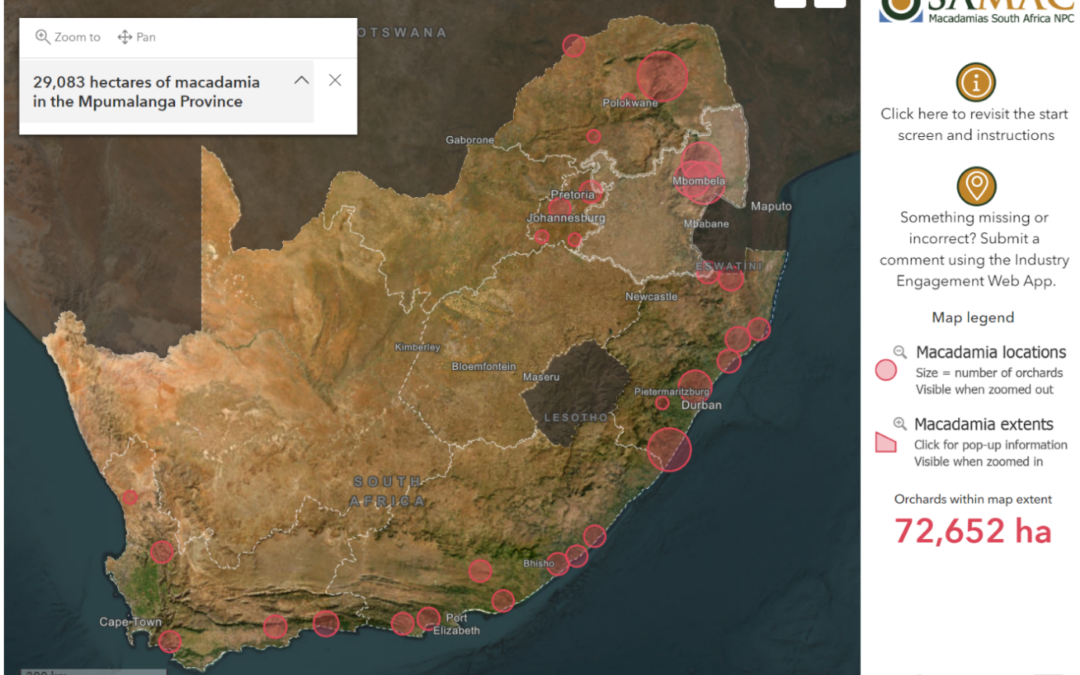
The map has been published in the SAMAC Dashboard application (https://arcg.is/1L1X900 , Fig 1). The dashboard is available publicly, and includes functionality to return summary metrics for total area by province, as well as interactively based on the view extent of the user. Instructions are provided, and the researchers have also included a button to support on-going updates to the map which directs viewers to submit feedback using the IEWA if they notice something missing or incorrect in the map.
Annual planting of macadamia orchards across South Africa has now been measured at 7 000+ ha/year, since 2019. As such, annual updates are recommended to maintain the accuracy and currency of the map.
Planting year prediction
Based on the map extent, AARSC have predicted the planting year of all orchards. To build the model, historical industry data was provided by Mayo Macs and Source B.I as training data (which included orchard planting age), analysed alongside historically acquired time-series Landsat satellite imagery (from 1986 – present). The resulting algorithm produced an average prediction error of ±1,8 years.
Applied to all ‘pixels’ within the map extent, AARSC have derived a map of macadamia orchards classified by planting year, which is summarised and presented cumulatively by province in Figure 2. Note the gap between 2019-2021 is due to the coarse resolution of the satellite pixels (30 m) not being able to detect the age of new plantings accurately. Total areas for 2022 are derived directly from the map.
Yield forecasting
A methodology for yield forecasting at multiple-scales (originally developed for Australian orchards, Brinkhoff, J. & Robson, A., 2021) was applied to South African orchards. The model, which utilises historic orchard level productivity information as well as publicly available data (satellite, weather, elevation), typically achieves average errors of 25% at the block level and <15% at the farm level in Australia. This varies from farm-to-farm and in the presence of extreme drought or flood conditions.
The model was applied to a database of South African macadamia block yields: 12 farms, 320 blocks, > 1 200 records. Correlations between yield and remote sensing indices were very similar to those in Australia, with the green normalised vegetation index (GNDVI) around the middle of the year being the strongest predictor.
Yield predictions were quite accurate for the majority of blocks, but the model tended to under-predict some of the very high yielding blocks (> 4 t/ha). Model prediction errors at the block level tend to cancel when aggregated to the farm level.
Table 1 shows the yield predictions for each farm for 2021, using a model developed using only data from before 2020. The production for four farms were predicted with less than 10% error. Farm number 4 had predictions double what was actually achieved, possibly associated to harvest losses from monkeys, as the farm is adjacent to bush lines. If the case, this process could be used to better quantify harvest losses (from a range of influences) and as such better inform if remedial measures are required.
In summary, it was found that similar relationships between satellite-derived remote sensing indices and yield in South Africa to those modelled in Australia. Whilst yield forecasts in the South African case were not as accurate as typically achieved in Australia, the methodology shows promise, as it was able to describe much of the variability between low and high yielding blocks. As more orchards reach maturity, and higher yields are available in the database, it is likely that prediction performance will continue to improve.
Contact
Mapping: Craig Shephard (Senior Researcher, AARSC) [email protected]
Yield and planting year: Dr James Brinkhoff (Assoc. Professor, AARSC) [email protected]
Other enquiries: Prof Andrew Robson (Director, AARSC). [email protected]
Acknowledgement
This project is led by the Applied Agricultural Remote Sensing Centre at the University of New England, Australia (AARSC) with support from Macadamias South Africa NPC (SAMAC).